时间:2024-02-21|浏览:323
分析师可以使用许多模型和指标来评估周期中任何给定点的市场风险。在本文中,我们将特别将“风险”视为比特币现货价格大幅下跌的风险。
因此,“高风险?”被定义为市场可能陷入投机泡沫的点。相比之下,“低风险?”环境被认为是大部分投机性过剩已被清除的环境,并且市场更有可能处于底部形成模式内。
价格泡沫
作为第一个构建块,我们监控价格与两个长期均值回归基线的偏差:
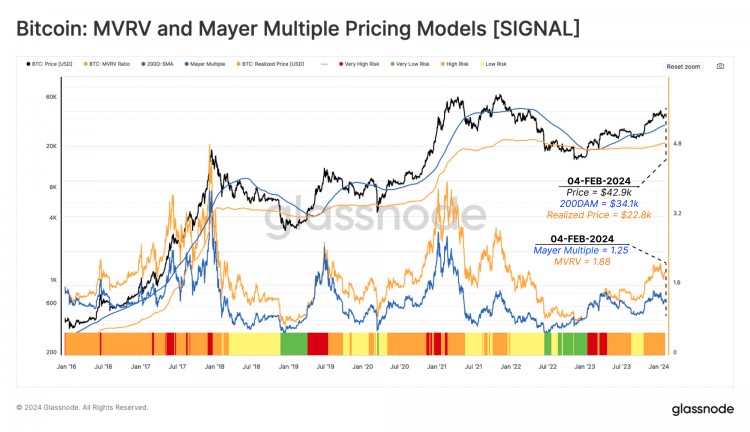
MVRV 模型
?:该模型衡量现货价格与市场整体成本基础(已实现价格)之间的比率。
Mayer Multiple
:利用 200D-SMA 作为技术周期中线,衡量相对于该基线的溢价或折价。
在下图中,我们结合MVRV
和
Mayer Multiple (MM)
模型定义了以下风险类别
。
目前现货价格为 42,900 美元,实现价格和 200 天移动平均线交易价格分别为 22,800 美元和 34,100 美元。这使市场处于
高风险?
环境中。
现场工作台
衡量供应盈利能力
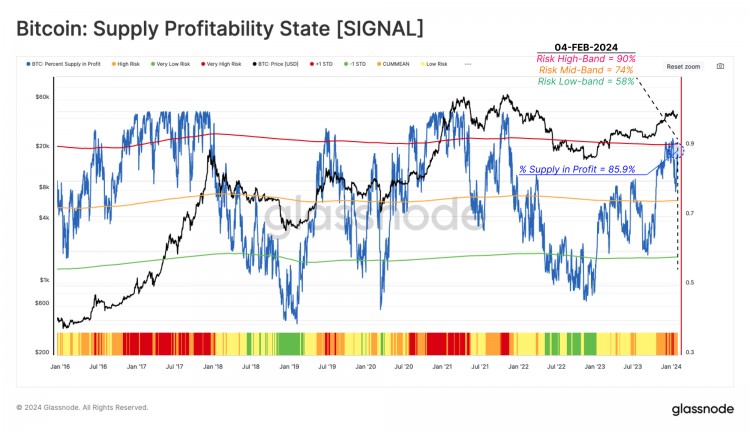
利润中的供应百分比 (PSIP) 指标衡量成本基础低于当前现货价格的代币比例。随着投资者看到获利的动机不断增强,该指标可以帮助识别抛售压力增加的潜在风险。
当该指标交易高于上限时,从历史上看,它与市场进入牛市的“欣快阶段”保持一致。在最近围绕现货 ETF 推出的市场反弹期间,该指标达到了
极高风险
?,随后价格收缩至 38,000 美元。
现场工作台
衡量恐惧和贪婪
量化市场上日益增长的
恐惧和贪婪
情绪相关风险的另一个强大工具是
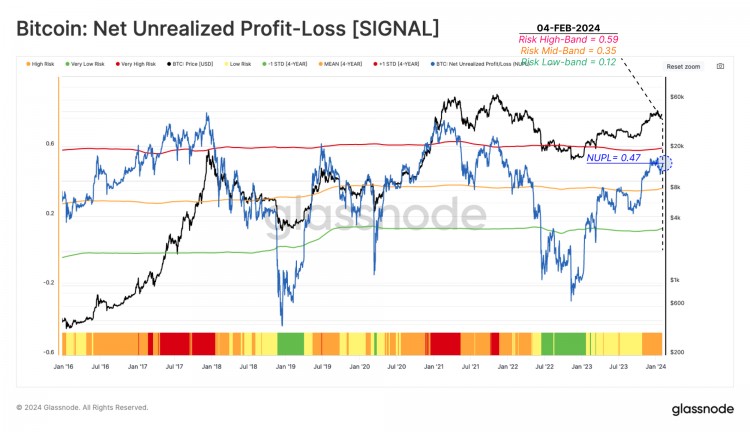
未实现净损益 (NUPL)
指标。该指标检查净利润或亏损总额的美元价值占市值的百分比。
因此,在使用利润中的供应百分比
估算出盈利的币数后
,我们可以使用 NUPL 来衡量投资者盈利的大小。
Following the October 2023 rally, NUPL entered the High Risk ? range, reaching a value of 0.47. Despite the significant jump in coin volume held in profit, the magnitude of USD profit did not reach the Very High Risk ? state. This suggests a large proportion of coins were accumulated at a cost basis around the ~$30k consolidation range throughout H2-2023.
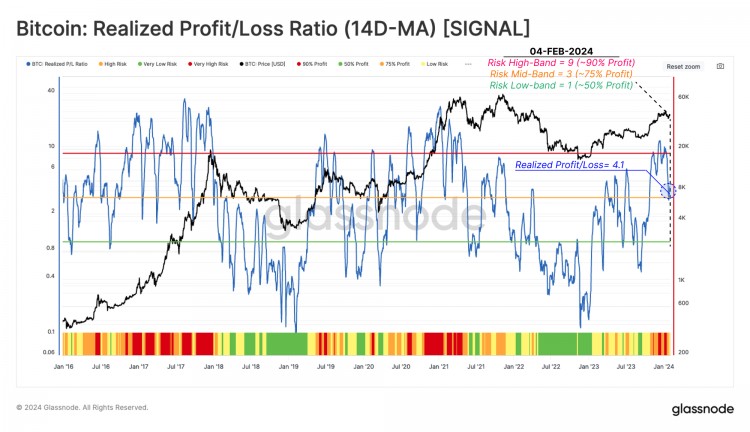
The next step is to assess how market participants are adjusting their spending patterns, with the Realized Profit/Loss Ratio (RPLR) being an excellent compass to achieve this goal.
This indicator tracks the ratio between profit taking, and loss taking events occurring on-chain. We use a 14D-MA of this ratio to smooth out the daily noise and more clearly identify macro shifts in investor behavior.
This indicator recently flagged a Very High Risk ? regime as prices hit the recent $48.4k peak. The Realized Profit/Loss Ratio is currently at 4.1, residing in the High Risk ? condition.
Switching gears slightly, we will now assess risk through the lens of demand, measured using a suite of adoption metrics related to network activity.
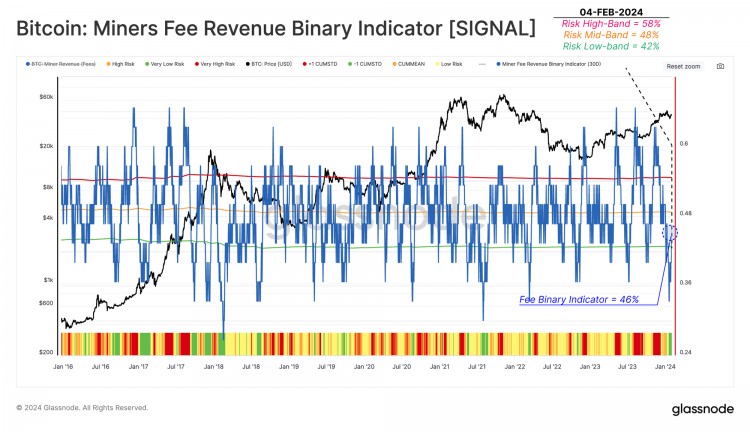
Given the capped blockspace in the Bitcoin network, a powerful method to gauge demand is via examination of the fee market. Usually, consistent growth in demand leads to a sustained rise in fees, as competition for inclusion in the next block increases.
The Miners Fee Revenue Binary Indicator (MFR-BI) shows the proportion of days over the last 30 days where the fee market has seen increasing pressure day-on-day.
During the sell-off drop to $38k, this indicator triggered a Very Low Risk ? signal. As spot prices bounced back to $43k, this metric returned back to the Low Risk ? zone (~46%).
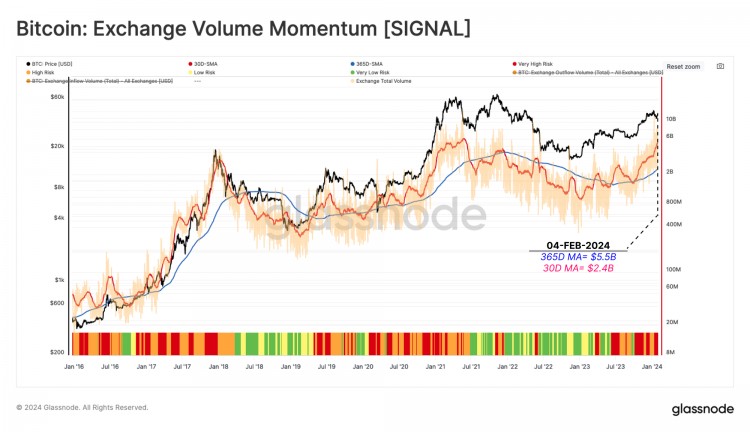
As the last component of the activity risk analysis suite, we revisit the Exchange Volume Momentum metric, which compares the monthly and yearly average of volume transferred from/into all exchanges. This tool acts as a proxy for the market's appetite for speculation.
This risk indicator measures the magnitude and direction of change in the faster monthly moving average’s (30D-MA) relative to the slower yearly moving average (365-MA).
The monthly average of Exchange Inflow Volumes has been trending strongly higher since October, putting this indicator in the Very High Risk ? regime. This suggests that the market is currently in a relatively speculative state.
The risk analysis above considers a relatively macro and global perspective. In this next section, we will assess patterns at a more granular level, considering the behavior of short-term and long-term holder cohorts.
Revisiting the conclusions made in prior reports (WoC 38, 2023 and WoC 50, 2023), Short-Term Holders tend to have an outsized influence in shaping near-term price action, such as local tops and bottoms.
Therefore, we take a Cause and Effect approach for spotting high (or low) risk intervals. This is based on a two-step assessment:
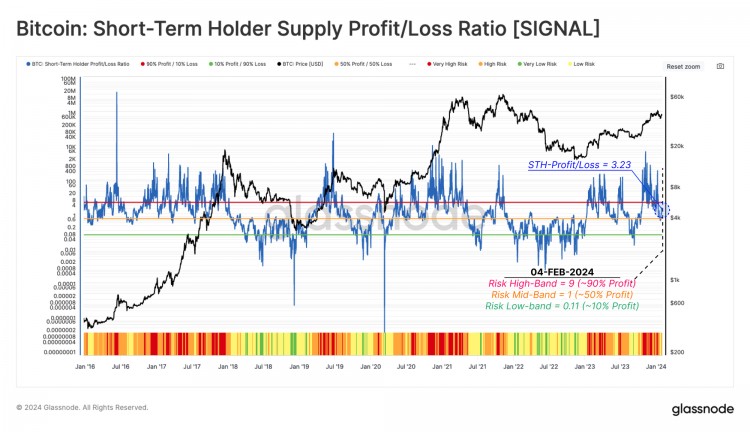
We start with the Short-Term Holder Supply Profit/Loss Ratio (STH-SPLR), which captures the balance between supply held in profit vs loss for new investors.
This indicator recently signalled a Very High Risk ? condition between mid-Oct-2023 and mid-Jan-2024 as ETF speculation peaked. This suggested that a super-majority of new investors were profitable, suggesting an increased probability of profit-taking. This has since cooled off towards the neutral Low Risk ? range.
The next step is focusing on the actual spending by these Short-Term Holders, measured through the lens of their realized profit or loss. The chart below highlights examples of high profit-taking ? (or loss-taking ?) regimes since January 2016. As shown, these periods of high spending tend to coincide with both strong rallies and corrections.
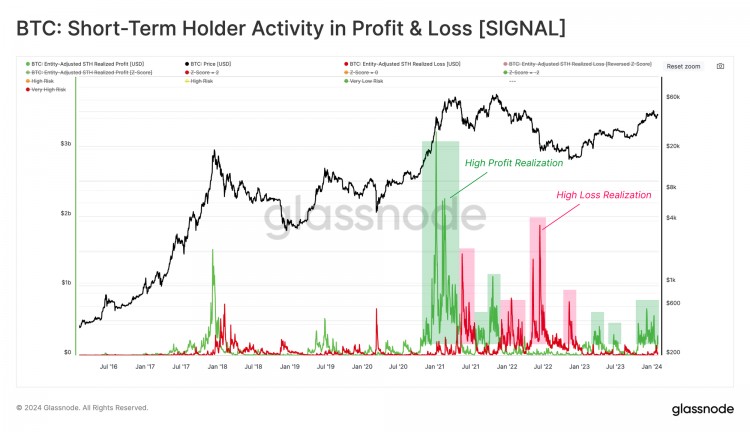
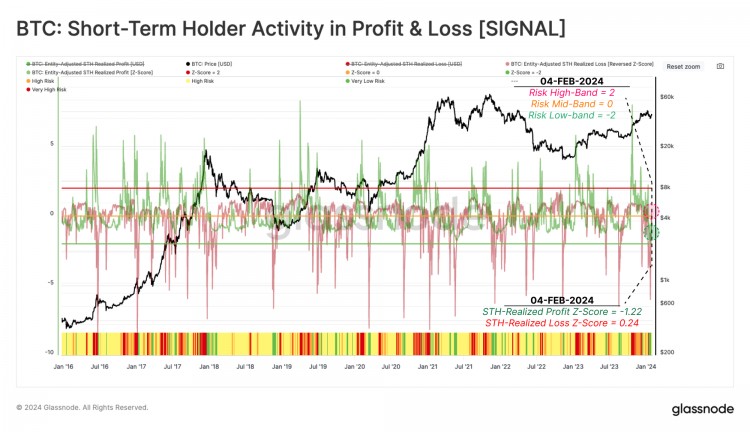
We transform and normalize these metrics using a 90-day Z-Score function, which standardizes this USD-denominated activity of short-term holders. This technique helps to spot when short-term holder spending is outside statistical extremes, which can be translated into potential local top and bottom formations within the market.
Note that to improve the visual aspect of this risk indicator, we have inverted the realized loss z-score (multiplied by -1).
The recent correction to $38k following the ETF launches caused a notable reduction in market risk according to this metric. The STH-Realized Profit Z-Score is currently at -1.22, while the STH-Realized Profit Z-Score is at -0.24. This places the present market structure in the Low Risk ? regime.
We introduced a framework similar to the Short-Term Holder Risk assessment above, except it focused on Long-Term Holders (LTHs) in a prior report (WoC-22-2023). The goal is to assess when the degree of unrealized profit held by the Long-term holders has advanced to statistically extreme levels, then trace whether this cohort ramps up their spending accordingly.
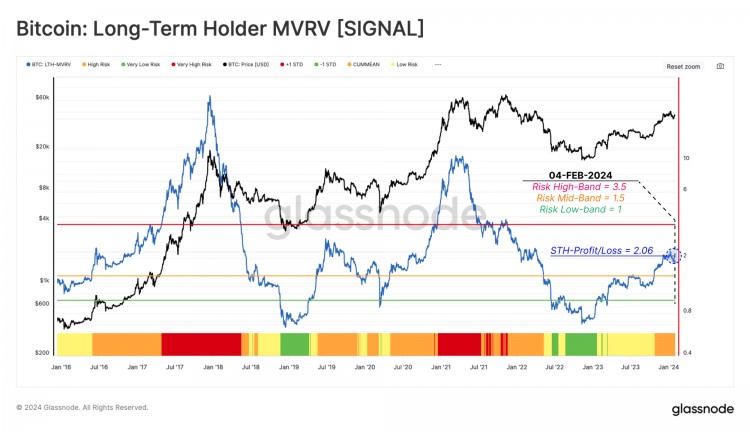
The first indicator gauges the unrealized profit component of LTHs using the Long-Term Holder MVRV Ratio. This measures the divergence between the market price, and the average LTH cost basis.
After the challenging recovery since the FTX collapse, this indicator has advanced to 2.06, entering the High Risk ? regime. As noted, these levels are typically seen during the early stages of bull markets, as long-term investors return to a relatively meaningful level of profitability.
In this risk analysis study's final step, we built a binary indicator to assess when LTH spending is increasing at a sustained rate. The Long-Term Holder Sending Binary Indicator (LTH-SBI) tracks periods when LTH spending is sufficient to decrease the total LTH Supply over a sustained 7-day period.
When LTH supply decreases, it indicates a reintroduction of long-dormant supply back into liquid circulation, working as an offset to new demand.
The ETF speculation rally towards $48.4k pushed this risk indicator from Low Risk ? into the High Risk ? range. The current value is 0.7, suggesting a degree of elevated spending by LTHs, as investors and ETF re-balancing (namely from GBTC) transfer coin ownership.
Live WorkbenchIn this piece, we developed a procedure for assessing the risk of a drawdown within the Bitcoin market. These risk factors consider a wide set of data and investor behavior categories, helping to establish a framework for analysts and investors.
Whilst each indicator can be used individually, the combination often provides a more comprehensive picture of the state of the market. The chart below compiles these into a heatmap view of the various risk indicators over the last 5-years. From this, we can compare the indicators to noteworthy tops and bottoms, where significant confluence can be seen.
The levels and transformations are intended as an initial guide and should be iterated on by analysts and practitioners to optimize for specific points of interest.
Disclaimer: This report does not provide any investment advice. All data is provided for information and educational purposes only. No investment decision shall be based on the information provided here and you are solely responsible for your own investment decisions.
Exchange balances presented are derived from Glassnode’s comprehensive database of address labels, which are amassed through both officially published exchange information and proprietary clustering algorithms. While we strive to ensure the utmost accuracy in representing exchange balances, it is important to note that these figures might not always encapsulate the entirety of an exchange’s reserves, particularly when exchanges refrain from disclosing their official addresses. We urge users to exercise caution and discretion when utilizing these metrics. Glassnode shall not be held responsible for any discrepancies or potential inaccuracies. Please read our Transparency Notice when using exchange data.
有关核心链上指标和交易所活动的自动警报,请访问我们的 Glassnode 警报 Twitter

![[HTX公告]HTX加密货币牛市PEPE交易大赛](/img/btc/25.jpeg)
![[HTX公告]HTX加密货币牛市PEPE交易大赛](/img/btc/46.jpeg)

![[HTX公告]赢取额外7.5B $HTX:邀请好友加入HTX期货史诗空投](/img/btc/75.jpeg)

![[HTX广场]HTX 研究 | 哪个项目将引领发展议程领域?DA 战争分析:背景、生态系统、](/img/20240227/3621533-1.jpg)